Periodicity in Annual Weight Changes |
17 May 2015
|
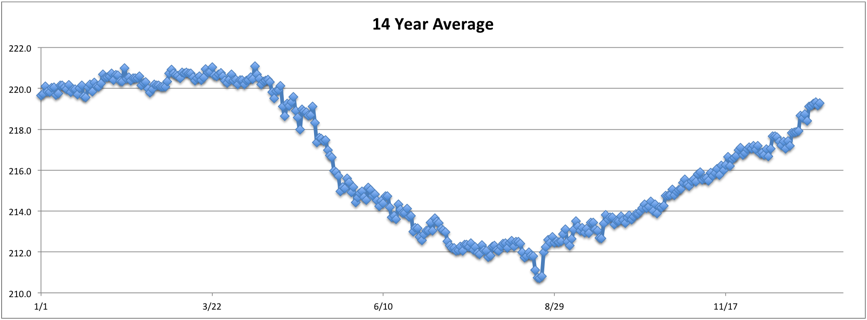
So I interpolated between recorded weights and then averaged over the 14 years of data that I have. I find it rather interesting that the curve is fairly smooth except for a blip around my birthday. The year can be nicely broken down into three parts: stasis, loss and gain. The fact that the signal is so strong over the years probably means it's a natural occurance. Fatten up for winter. Minimize activity during the cold months. Lots of activity during the spring/summer. I weighed in at 215.8 lbs on Friday which is pretty darn close to average for this time of year. Looking at this graph it seems fairly clear that any control I believe I have over my weight is an illusion. As I remarked in 2011, small victories on the road to inevitable defeat. In 2010 I was in worse shape than I am today though, topping out at 240 rather than the 220's of this past winter. I like to think that this is some effect of actions I have taken, but those heaviest weights correspond to the long cold winters of Nebraska. It kind of makes me wonder if I'd be fat at all living yearround in a tropical climate. |

Last change was on 20 May 2015 by Bradley James Wogsland. Copyright © 2015 Bradley James Wogsland. All rights reserved.